
By: Josh Murray
Introduction
In the early days of CHART we found ourselves rewriting a lot of the same code blocks over and over. Not only is this a time consuming process, but it often involves recreating the wheel, for any new employees. One of the main programming languages used by the data science team at CHART is the R language. With the R language you can write packages that contain those blocks of code within a functions. These packages can be shared across the team and can be loaded into any R session using the libary() function. Writing packages also gives you great opportunity to write documentation for your functions.
In this post, I show you the easy steps to follow to begin creating an R package in RStudio, and I will share some of the functions we have found useful to include in the package.
Creating an R Package
Before creating the package, there are two prerequisite packages you must install: devtools and roxygen. Use the code below to install those packages.

From the menu at the top of RStudio select File and then New Project…. the following box appears

Select New Directory to reveal the following

Then select R project and enter the name of your package in the package name field below.

I recommend using github and the packrat packages, but I won’t get into those details here. For now, simply click on the Create Project button.
You will notice the following files have been created in your package directory
DESCRIPTIONNAMESPACE/man(a sub-directory for documentation)/R(a sub-directory for code)
The Code
In the /R sub directory we will store all of our functions for the package.
Useful functions
Here I will describe functions that have been useful for the CHART team.
Connecting to databases
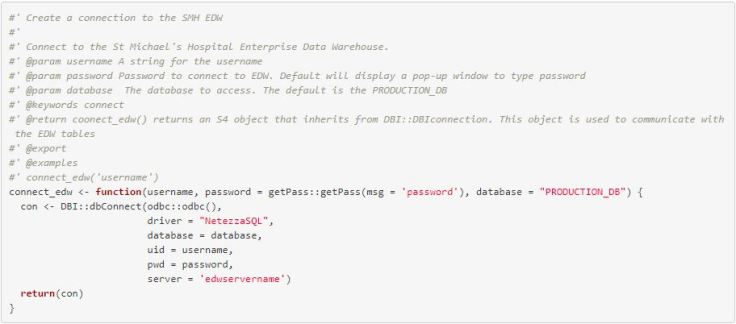
These are very simple functions which will save lots of time. R has some create resources for connecting to accessing tables stored in databases. One of the first functions we wrote is for connecting to our Enterprise Data Warehouse or EDW. The code for the function is below:

The function takes as input the username, a password, and a database name. The database name is defaulted to the production database, and the password uses the getPass function which will prompt you to enter your password in a popup window when the code is run. This is useful for not storing your password in any scripts. Now, instead of rewriting the above chunk every time you connect to the data, a user can simply type con <- connect_edw('myname').
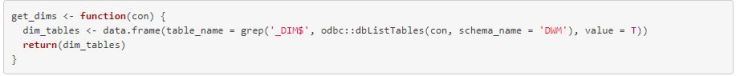
Listing available tables in schemas
Our warehouse is split into several different star schemas made up of fact and dimension tables. We have written some very simple functions to list which tables are available in those schemas. For example, to get the dimension tables available in our dimensional layer, we have the following:
Other Examples
In addition to the examples above, we have found it useful to write functions for
- Routinely performed calculations (eg. https://science.data.blog/2018/10/10/calculating-volumes-from-timestamps-using-r/)
- Colour palettes: These are useful for branding
- ggplot theme: For making consistent plots
- Query library: We store some of the more commonly used queries in our package (eg. Extracting inpatients with 30 day readmission)
Documentation
As you write your functions it is good practice to include documentation. The https://github.com/klutometis/roxygen package makes this an easy task. To use the package you simply describe the functions and its parameters next to special comment characters of the form #'. Hopefully this will become clear with the example below for the connect_edw()function:
The first line will be a title line. the second line is for a longer description. This will be followed by a series of keywords and their values: @param is for the function parameters, @keywords is for search help, @return is for a description of the function return, @export will export the function to the NAMESPACE file, @examples is for a series of examples. See the documentation for all keywords.
Once you have written your documentation, run devtools::document() at the command line. This will add a .Rd file to the /man directory.
Metadata (DESCRIPTION file)
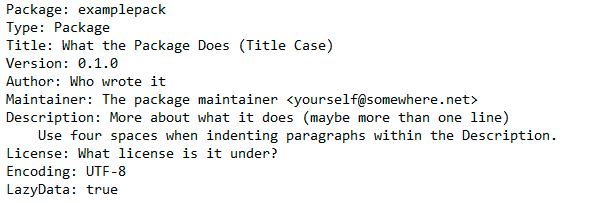
The DESCRIPTION is where you include metadata about your package. This includes information about who wrote the package and where they can be contacted, a description of the package, and who can use it. In addition, you will specify which packages are required for your package to work properly.
Below is the default DESCRIPTION file created when you make a blank package:
In particular, you will specify which packages to import, and which packages are suggested:
Imports: packages that are required for your package to workSuggests: packages which are required but are needed to take full advantage of your package
At the time of package installation, Imports packages will be installed if they aren’t already on your computer. You can add packages to your imports list with devtools::use_package("ggplot2", "Imports"), and to your Suggests list with devtools::use_package("ggplot2", "Suggests").
You can explore github or CRAN to see examples of DESCRIPTION files (e.g. https://github.com/tidyverse/dplyr/blob/master/DESCRIPTION, https://github.com/tidyverse/ggplot2/blob/master/DESCRIPTION).
Build your Package
To build and load your package you can use the shortcut: Crt + Shift + B. This will make the package available to your local computer. It can then be loaded with library(yourpackage).
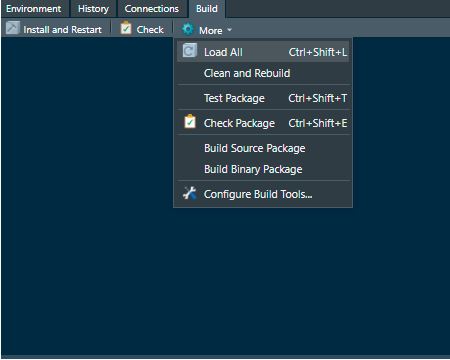
To share the package with others you can either use github with install_github('package_name','github_username'), or you can export your package to a source file using the build tab in RStudio:
The package can then be installed on other computers using install.packages(“path_to_file”, source = TRUE, repos=NULL).
Conclusions
We’ve only touched on the very basics of building R Packages. Here are a couple of extremely useful resources:
- http://r-pkgs.had.co.nz/: A freely available book that walks through basic and advanced topics for building R packages
- https://kbroman.org/pkg_primer/: Comprehensive documentation on building, documenting, and exporting R packages
- https://cran.r-project.org/doc/manuals/r-release/R-exts.html: R documentation on writing R extensions
Writing an internal CHART package has helped distribute useful code across the organization. We have found building functions for connecting to the EDW, commonly used queries, commonly used data preparation steps, and standardized plotting functions to be a particularly high yield. The package lives on our private github page where it is constantly updated. The vignettes and documentation are very useful and act as an introduction to the database for new employees and students.
